Use the TEDS2016 dataset to run a multiple regression model. Access the data set using the following codes
(Adapted from Stackoverflow examples) (Objectives: Use plotly, reshape packages, interactive visualization)
Call:
lm(formula = Petal.Length ~ 0 + Sepal.Length + Sepal.Width, data = iris)

Residuals:
     Min       1Q   Median       3Q      Max
-1.70623 -0.51867 -0.08334  0.49844  1.93093

Coefficients:
             Estimate Std. Error t value Pr(>|t|)
Sepal.Length  1.56030    0.04557   34.24   <2e-16 ***
Sepal.Width  -1.74570    0.08709  -20.05   <2e-16 ***
---
Signif. codes:  0 '***' 0.001 '**' 0.01 '*' 0.05 '.' 0.1 ' ' 1

Residual standard error: 0.6869 on 148 degrees of freedom
Multiple R-squared:  0.973, Adjusted R-squared:  0.9726
F-statistic: 2663 on 2 and 148 DF, p-value: < 2.2e-16a. Age
b. Education
c. Income
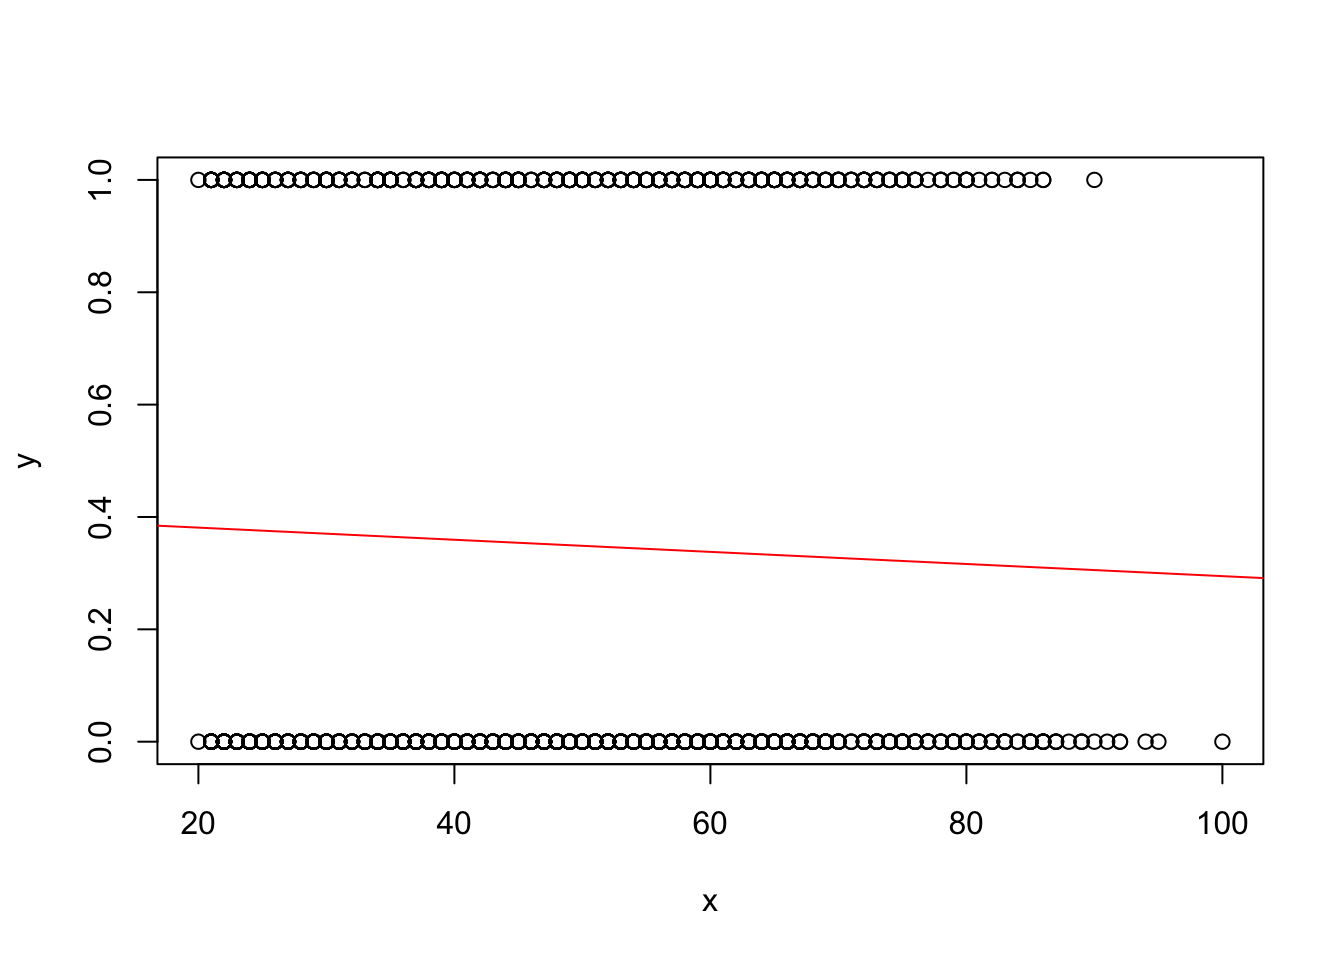
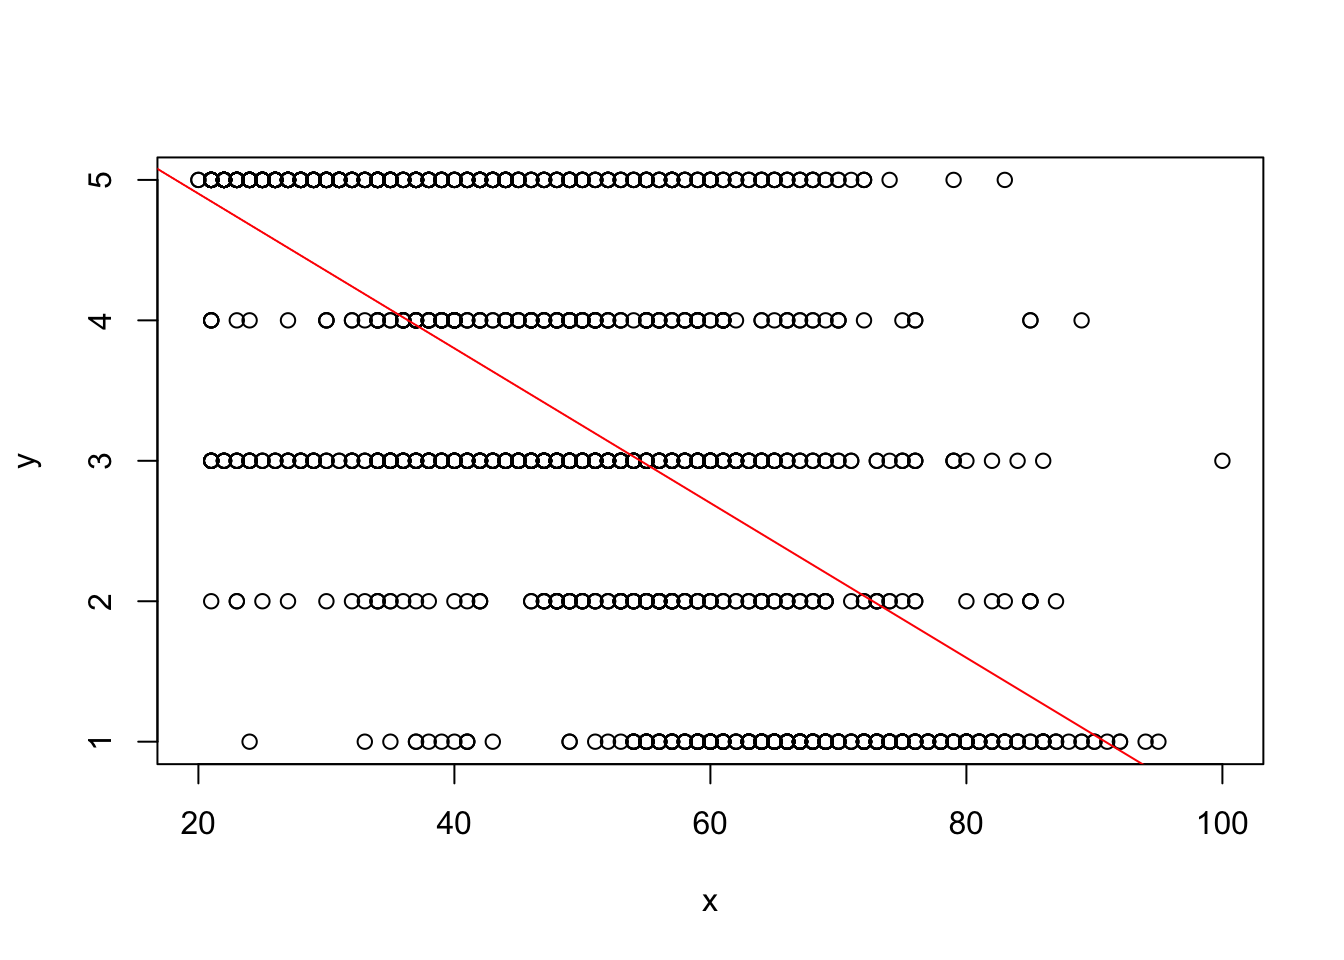
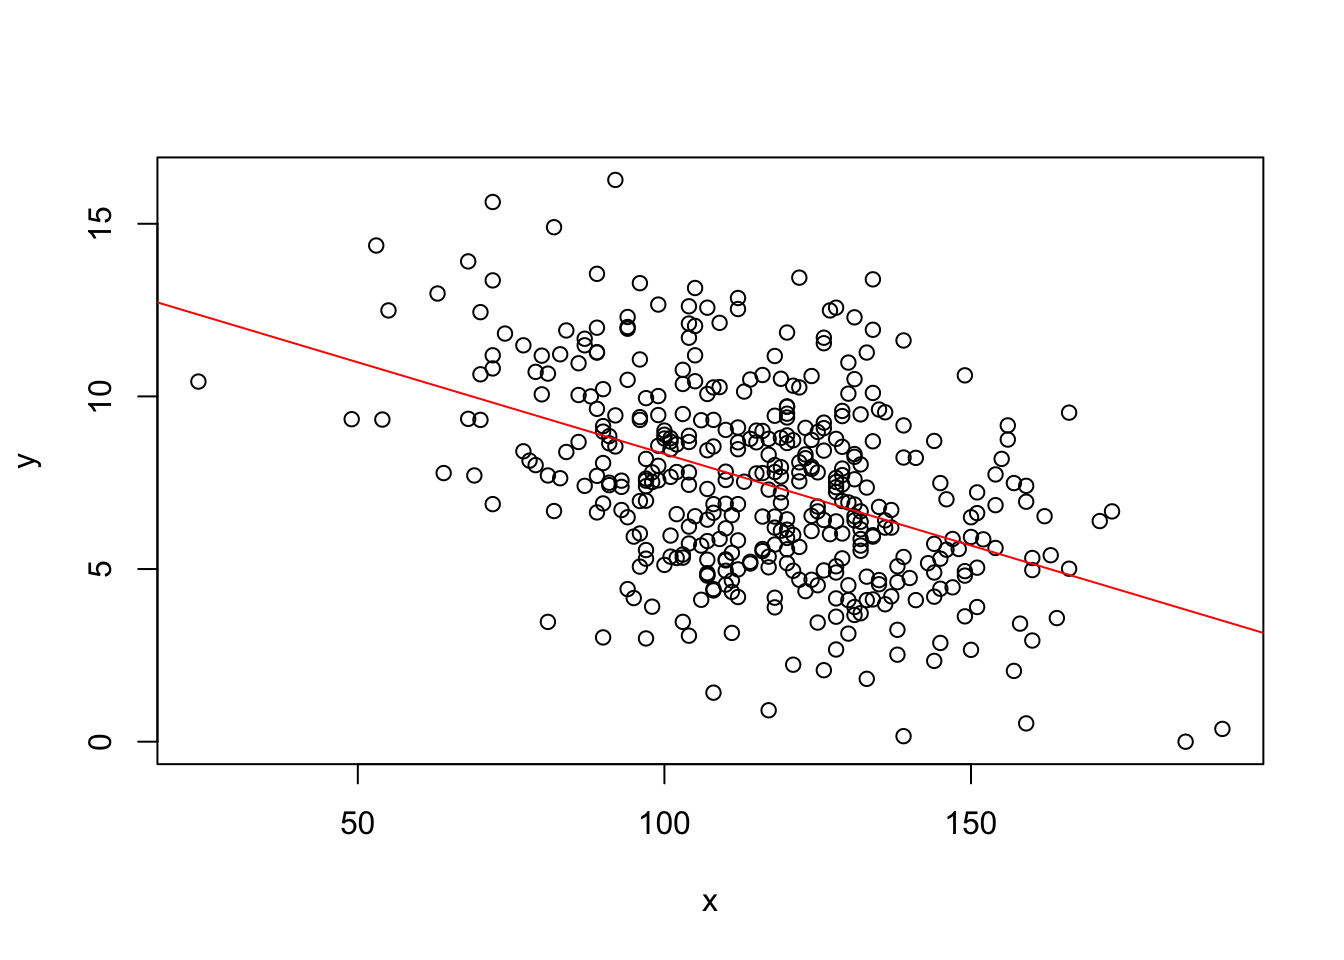
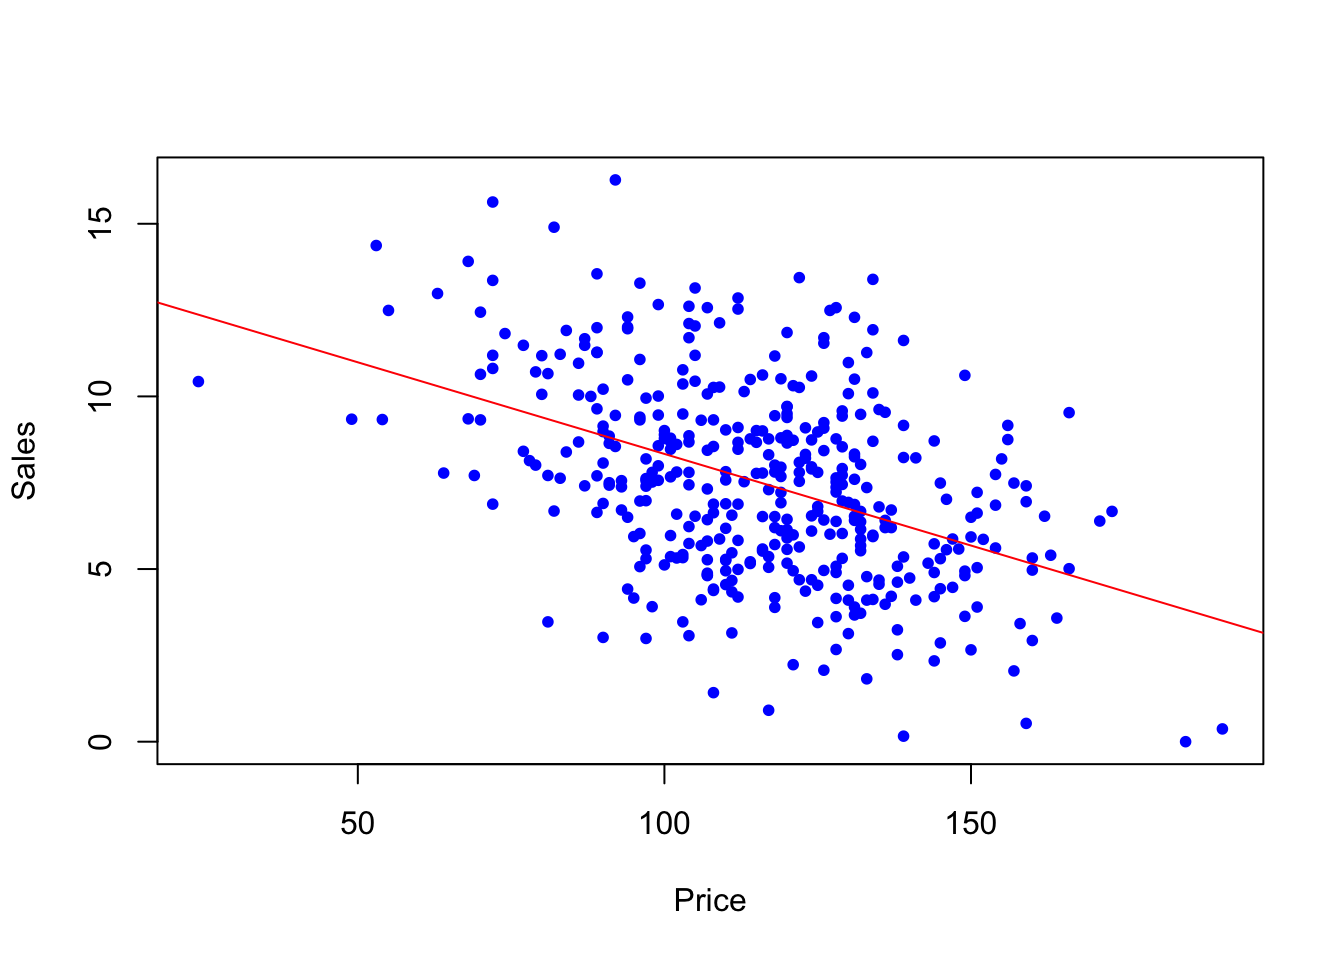
The problem it looks like with my variables is that it doesn’t seem like plotting a linear regression is enough and there might need to be a multinomial logistic regression. Since some of the variables are discrete, a simple regression might not be enough.